In the Quiz Edit page, we show a number of metrics for each question. Two are new; all deserve explanation.
- Type: there are six question types with thousands of permutations.
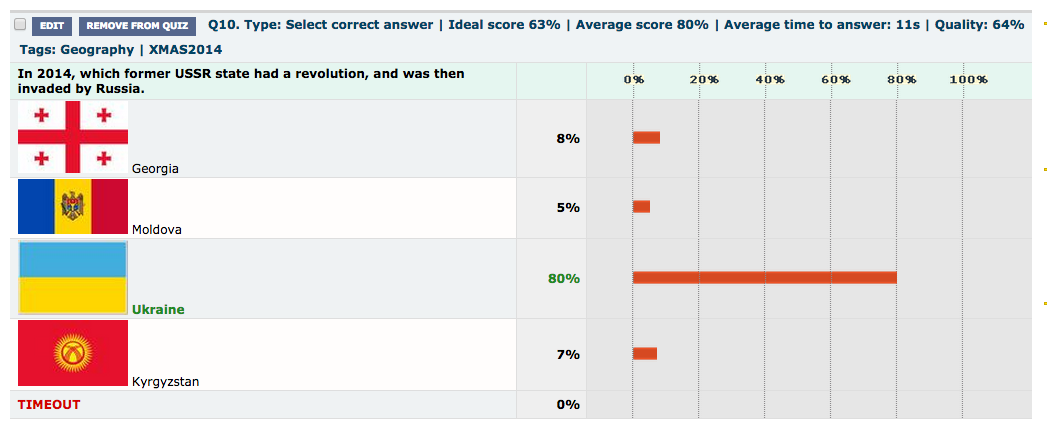
- NEW Ideal score: For any specific question type and permutation, there is an optimum score that will deliver maximum discrimination between the kids who can answer the question, and those who are guessing. This is half way between 100%, and the average score that would be achieved over a large number of blind guesses. In the example above there are four options of which only one is correct, so a guess would have a 25% chance of being right. 100-(100-25)/2=62.5 which is rounded up for display purposes to 63%.
- NEW Average score: The score actually being achieved by all students (not just your own) who have taken this quiz since it was last updated. Now you can easily see how close to the optimum you are getting. When reviewing a quiz that has been available for some time, and has had 1,000 or more runs, this is the first place you should be looking.
- Average time to answer: This gives you an idea of how difficult to comprehend the question is. A ‘slow’ question may be prompting students to really think (good) or it may be throwing them into confusion (bad).
- Quality: The quality metric is based on multiple criteria, one of which is how close to the optimum students are actually scoring. A question that is too hard or too easy for its context is lower-quality than one that just hits the sweet spot.

Leave a comment