
If you want a per-student, per-question, per-attempt view of your results, come to
Assignments tab -> Results -> Results in Detail
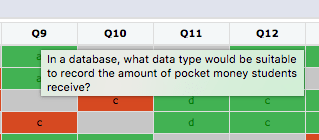
You will see you have the traditional traffic-light colour-coding for correct, partial and incorrect answers.
Grey cells are questions that were not presented. The Yacapaca model is that each quiz is a randomised selection of questions from an underlying question bank. You choose how many questions to show when you assign the quiz; with each attempt, the student sees a fresh selection in a fresh order. This improves summative reliability as the questions cannot simply be rote-learned.
The Detail View crams a lot of data into a single screen, so we had to make a few compromises to make everything fit. To read each question, hover your cursor over the question number, like this…

…and to see the text of each student’s response, hover over the answer cell.

If your screen is smaller than the size of the table (lucky you if you have a large screen or a small class!), the table scrolls intelligently within its frame. On an iPad or trackpad device, use two fingers to scroll it.
We have now covered three of the results pages: Gradebook, Activity Log and Detail View. I recommend you also read this overview of how they fit together with each other, and with the more minor results views.
Read next – Tutorial 8: Quick Assignments

Leave a comment