Log into your Yacapaca teacher account and go to
More tab -> Progression Charts
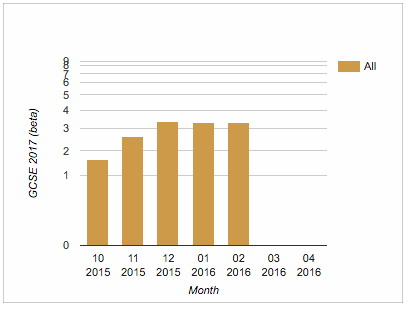
For each of your student sets, you will see something like this:

You can select some or all sets to compare with a simple search field.
But you can do a lot more than this. You can also break down the analysis by multiple criteria:

The categories available depend on the metadata you have uploaded, with the exception of gender. If explicit gender data was not provided at time of upload, Yacapaca will look up each student’s forename to make a best guess. In the example below, Yacapaca could not work out some of the forenames and created a third ‘undefined’ category.
(Update: 1/9/2017 Ethnic Origin is no longer available as an analysis category)

You can see in this example that the boys in this set are consistently outperforming the girls by almost a full GCSE grade.
I hope you enjoy exploring the feature and find it useful. We are experimenting with a monthly email of the most important results; look out for that in your mailbox soon.

Leave a comment